Rent per unit with comps
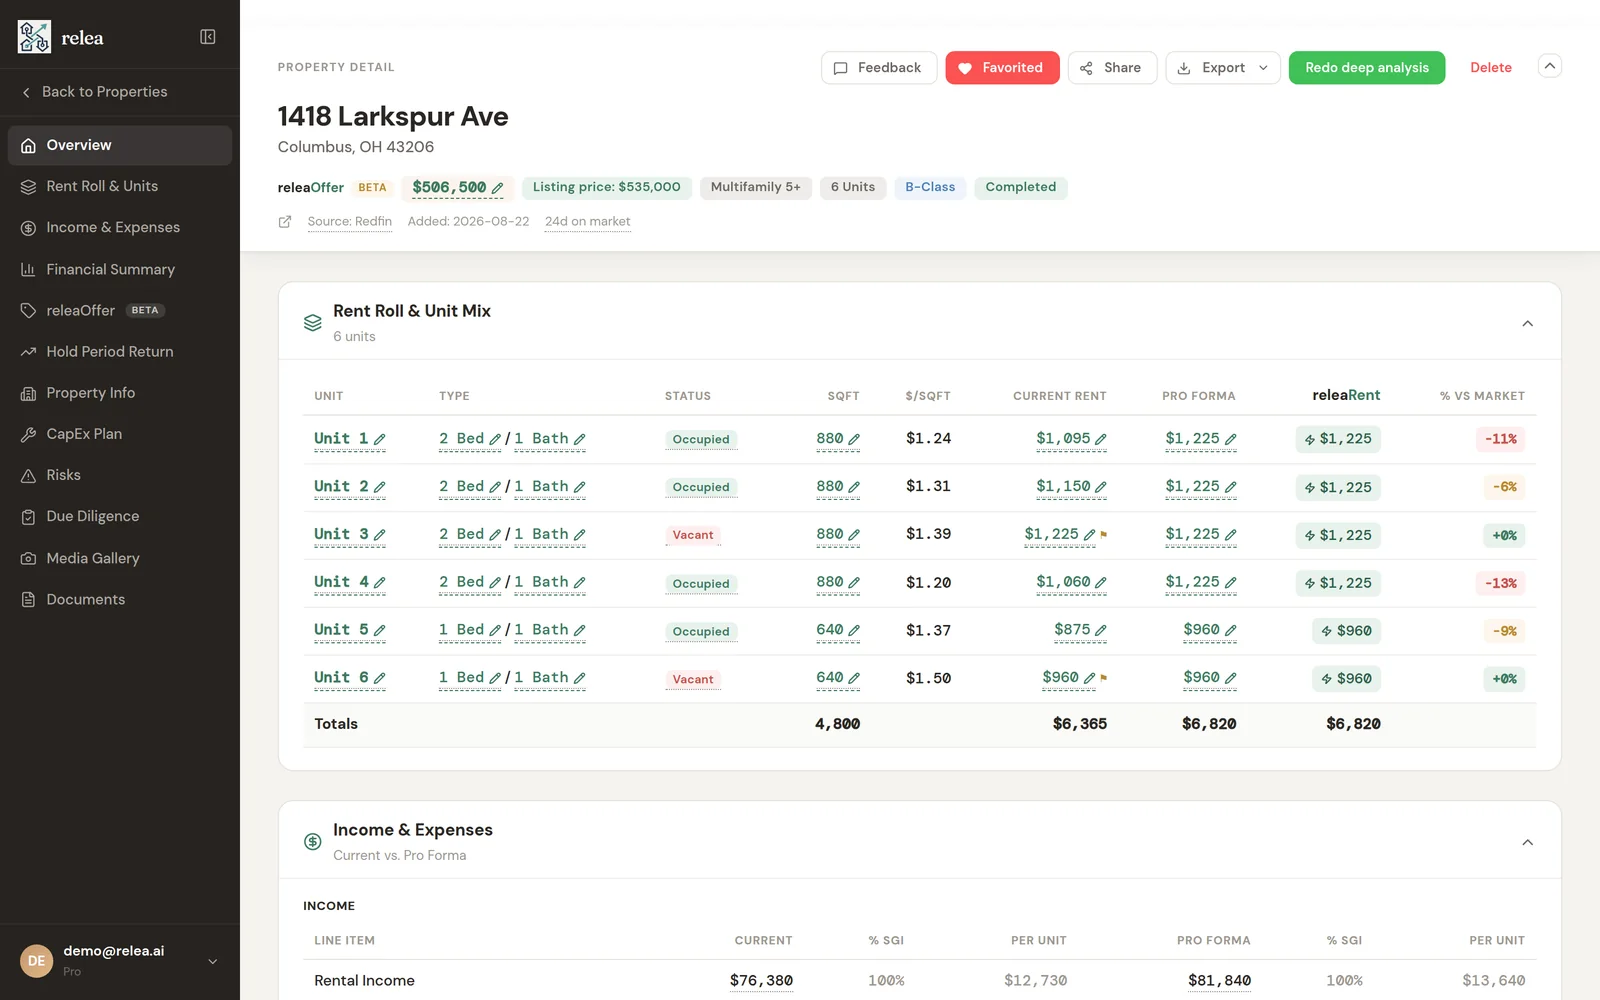
releaRent prices each unit type as a range from live rental listings and shows the comparable rentals behind it.
Free calculator, no account
Enter price and rent and get the GRM, rent-to-price, the 1% rule check, price per unit and the implied cap rate.
Price and rent
For the cap rate check
Example values. Change any of them. Estimates from the numbers you entered. Not an appraisal, a loan quote, tax advice or investment advice.
GRM is only as good as the rent you put into it. On a real listing releaRent prices each unit as a range from live rental listings, with the comps on the page, so the rent behind the multiplier is one you can defend.
Run it on a real listing →3 listings free. Sign up with Google or email. No card.
On a real listing
Every number on a relea listing shows its source. Built by a 20-year, multi-state operator: conservative by default, and every assumption can be overridden.
releaRent prices each unit type as a range from live rental listings and shows the comparable rentals behind it.
Taxes at your purchase price and CapEx by the building's age, the two costs a multiplier cannot see.
NOI, cap rate, cash-on-cash and DSCR, built from the same sourced rent.
The math
GRM is the price divided by the gross rent: how many years of gross rent, before expenses, the price represents. GRM = price ÷ annual gross rent. It’s the quickest way to compare a listing with recent sales, and the 1% rule is its monthly cousin.
Both are used in practice. Most commercial and multifamily resources use annual gross rent, so 8.93 for this sample building. Some residential investors use monthly gross rent, which gives 107.1 for the same building. Since the two numbers are 12x apart, it’s important to say which one you mean, and not to compare an annual GRM with a monthly one.
To value a building with a market GRM, take the GRM of recent sales of similar buildings in the area and multiply it by the annual rent of the building you’re looking at. A GRM of 9.5 on $67,200 of rent implies $638,400. The catch is that GRM is only comparable between buildings with similar expense loads, so focus on sales of buildings of similar size, age and utility setup.
GRM ignores expenses; cap rate does not. Two buildings with the same rent and price have the same GRM even if one has owner-paid heat and twice the tax bill of the other. Given the vacancy and expense ratios, the implied cap rate is (1 − vacancy) × (1 − expenses) ÷ GRM: 6.4% for this sample building, which is what the cap rate calculator says, as it should.
The 1% rule is a quick screen of whether a building’s monthly rent is at least 1% of its price. It isn’t really a valuation. It’s much harder to meet in higher-priced markets, where rents are lower relative to prices, and easier to meet in markets where taxes, insurance or vacancy take up most of the rent. This sample building fails the 1% rule at 0.93%; it would need $6,000 a month, or a price of $560,000.
Price per unit ($150,000) and rent per unit ($1,400) are another quick way to compare with recent sales. And rent per unit is the number to check against comparable rentals before you trust any of the above.
Before you trust the number
Questions
After your 3 free listings, pay as you go for as low as $3 per listing, or subscribe: Plus is $49 a month for 25 listings (about $1.96 per listing) and Pro is $149 a month for 150 (about $0.99 per listing). See plans
There is no universal “good” GRM, but a lower GRM means a lower price relative to rent. Compare with the GRMs of similar buildings recently sold in the same market, on the same basis (annual or monthly).
Use whichever you prefer, but say which one. Annual rent is more common in commercial and multifamily circles; monthly is used by some residential investors. The two differ by a factor of 12: 8.93 vs 107.1 for the sample.
The 1% rule says monthly rent should be at least 1% of the purchase price. It’s a fast filter but not always realistic: many pricier markets won’t meet it, while some cheaper markets meet it only with high taxes or vacancy. Use it to screen, not to decide.
GRM divides price by gross rent and doesn’t account for expenses. Cap rate divides net operating income (after vacancy and operating expenses) by price. For the sample, with 5% vacancy and 40% expenses, a GRM of 8.93 corresponds to a 6.4% cap rate.
From recent sales of similar properties in the area: divide the sale price by the annual gross rent at the time of sale. Brokers, appraisers and sale records with rent rolls are good sources.
Same fourplex, next question
All of these calculators open on the same sample fourplex, so you can carry one deal from one question to the next.
Three deals free. No card. relea builds the full model with sourced rent, taxes and CapEx.
Questions? support@relea.ai. We reply within one business day.